Broker's Opinion of Value
829 Ocean Park
Santa Monica, CA 90405
7Units
5,682Square Feet
1953Year Built
6,603SF Lot
Filip Niculete
Filip Niculete
Senior Managing Director Investments
Aida Memary Scher
Aida Memary Scher
Associate Director Investments
Glen Scher
Glen Scher
Senior Managing Director Investments

Prepared Exclusively for Peter Rodgers

September 2026

Team Track Record
Current Results, Local Market Experience, and Senior-Level Execution
LAAA Team | Marcus & MillichapLocal market knowledge. National reach. Senior-level execution.
494Closed Transactions
342Apartment Sales
8Within 1 miles
$1.56BTotal Sales Volume

Representative Local Closings

AddressUnitsSale Price$/UnitDistanceClosed
707 Strand St5$2,145,000$429,0000.32 mi2021
1753 9th St7$5,100,000$728,5710.70 mi2021
2224 Oak St6$2,700,000$450,0000.91 mi2021
96.7%Apartment Pricing Accuracy
34Median Days on Market, Apartments

Published team performance, laaa.com/track-record, as of September 2, 2026.

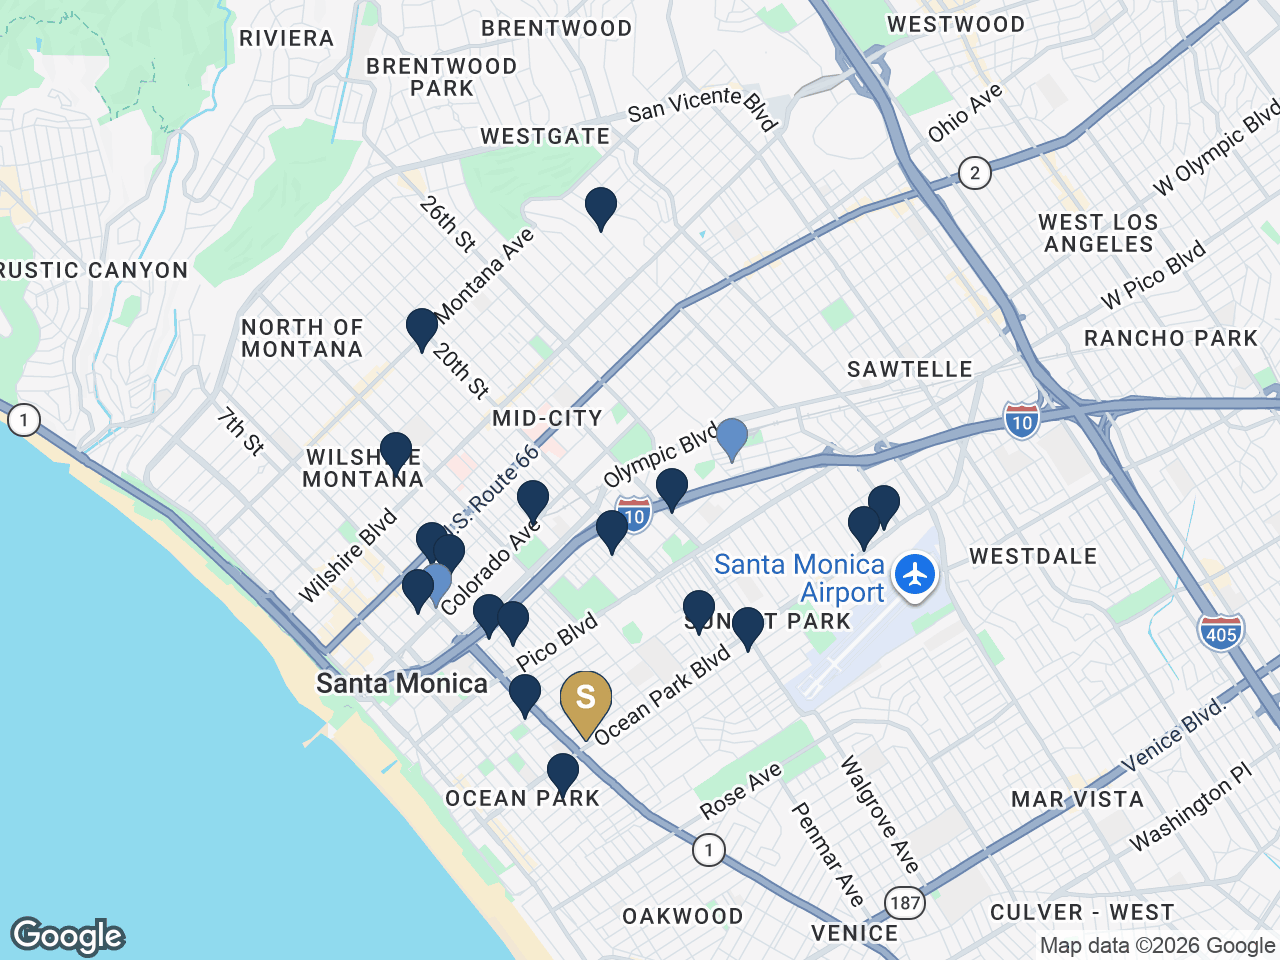
LAAA closings near 829 Ocean Park

829 Ocean Park is the gold marker. Navy markers are the 8 apartment buildings the LAAA Team has closed within 1 miles; lighter markers are 2 other LAAA closings in the same area. Repeat sales at one building share a marker. Source: laaa.com/track-record, as of September 2, 2026.

A Track Record Built One Assignment at a Time

A seven-unit rent-controlled building in Sunset Park is bought by a specific kind of owner: one who already holds small Westside buildings, understands the Santa Monica registry, and prices the two long-term tenancies as future upside rather than a problem. That buyer is on a list, not on a portal, and the list is what 494 closings and $1.56B in volume across 21 states and Washington, D.C. have built.

The Team Behind the Assignment
Filip Niculete
Principal
Filip Niculete
Senior Managing Director Investments
Filip Niculete advises multifamily owners and investors throughout Southern California with an emphasis on disciplined marketing and execution.
Aida Memary Scher
Aida Memary Scher
Associate Director Investments
Aida Memary Scher advises apartment owners across the Westside and the San Fernando Valley with the LAAA Team, with a focus on rent-controlled small buildings and disciplined marketing.
Glen Scher
Principal
Glen Scher
Senior Managing Director Investments
Glen Scher advises apartment owners and investors across Southern California with a focus on evidence-based pricing and transaction execution.
Morgan Wetmore
Morgan Wetmore
Associate, Investments
Logan Ward
Logan Ward
Associate, Investments
Luka Leader
Luka Leader
Associate, Investments
Alexandro Tapia
Alexandro Tapia
Associate, Investments
Blake Lewitt
Blake Lewitt
Associate, Investments
Mike Palade
Mike Palade
Agent Assistant
Tony H. Dang
Tony H. Dang
Business Operations Manager
Tirajeh Vossoughi-Horton
Investment Brokerage Intern
How We Market Your Property
Position the Story, Reach the Market, and Work the Buyer List
23,500+Active Email Subscribers
36,000+Owner & Investor Contacts
60,000+Buildings Tracked
100+Targeted Buyer Calls

Our public, continuously maintained reach combines active email subscribers, owner and investor contacts, a building-owner database, and targeted direct buyer calls for each listing.

The objective is not simply exposure. It is qualified competition for your property.

The Campaign Plan

01

Direct Owner and Investor Outreach

The campaign opens with calls. We start with the owners of every five to twelve unit building in Sunset Park and Ocean Park the team has sold or tracked, the buyers who bid on 824 Maple, 2332 20th and 711 Grant this year and did not win them, and the 1031 exchange buyers on a deadline who want Santa Monica rather than the Valley. A fully occupied building with a clean rent roll rewards a buyer who moves quickly, so the first two weeks are spent finding those people rather than waiting for them.

02

Full Platform Syndication

Every LAAA listing is advertised across the same ten platforms: TheMLS, CoStar and LoopNet, Crexi, Brevitas, Zillow, Redfin, ApartmentBuildings.com, DuxRE, MarcusMillichap.com and laaa.com. Syndication is source-stamped so we can tell you which platform produced each inquiry rather than reporting undifferentiated view counts.

03

Email Campaign and Reach

The property goes out to 23500 active email subscribers across an owner and investor database of 23500 contacts, then to targeted re-sends built from who opened and who did not. Campaign statistics are reported to you in full, including the misses.

04

Marcus & Millichap Agent Network

Marcus & Millichap's national agent network puts the listing in front of brokers whose own clients are looking for Westside multifamily, which reaches capital that never searches a listing portal at all.

Built In-House Buyer Research

Our team built the 16-database research system that develops a property-specific buyer list from ownership, acquisition, financing, and portfolio signals.

Direct Calls, Not Passive Exposure

We call the owners and investors most likely to act instead of relying on digital distribution alone.

Weekly Seller Intelligence

Calls, tours, buyer feedback, and offer activity are organized into a clear weekly campaign update.

We are proactive marketers rather than reactive ones. The offering is built, priced and staged before it is released, the outreach runs on a schedule you can see, and you get a written report on what happened rather than a summary of what we hoped would happen.

Our Active Multifamily Listings
Current LAAA Team Multifamily Availabilities and Escrows
AddressCityUnitsAsking Price$/UnitCapStatus
13724 Victory BlvdVan Nuys68$22,900,000$336,7655.50%Available
10455 Magnolia BlvdNorth Hollywood26$9,200,000$353,8465.03%Available
180 Holly AvenueCarpinteria19$8,950,000$471,0534.80%Available
2727 3rd StreetSanta Monica22$7,650,000$347,7275.16%Available
31701 Ridge Route RdCastaic33$7,500,000$227,2735.64%Available
3607 Pacific AveMarina del Rey6$5,395,000$899,1674.75%Available
2001-2005 Grismer AvenueBurbank14$5,350,000$382,1434.56%Available
755 E Pine StreetAltadena19$5,195,000$273,4216.68%Available
7018 Alabama AveCanoga Park9$5,100,000$566,6675.27%Available
4603 La Mirada Avenue & 1255 Lyman PlaceLos Angeles9$4,450,000$494,4445.28%Available
24846 Walnut StSanta Clarita16$4,200,000$262,5005.13%Available
12314 & 12320 Washington PlCulver City8$3,096,000$387,0005.00%Available
11025 Blix StToluca Lake4$2,700,000$675,0005.27%Available
1303-1305 Laveta TerraceLos Angeles10$2,590,000$259,0004.24%Available
1807 Montana StreetLos Angeles4$2,395,000$598,7505.84%Available
12231 Pacific AveLos Angeles7$1,900,000$271,4295.02%Available
5614 W Adams BlvdLos Angeles7$1,795,000$256,4296.52%Available
24513-24519 Walnut StSanta Clarita3$1,095,000$365,0004.31%Available
20234 Roscoe BlvdWinnetka25$4,750,000$190,0005.51%In Escrow
3361 Hamilton WayLos Angeles4$2,800,000$700,0005.62%In Escrow
24802 & 24806 Walnut StSanta Clarita7$1,725,000$246,4295.31%In Escrow
Total (21 listings)320$110,736,000$346,0505.27%

The LAAA Team is currently marketing 18 multifamily listings with 3 more in escrow, together representing 320 units and $110.7M of asking value. Every assignment runs on the same marketing platform proposed for 829 Ocean Park.

Listings and statuses as published at www.laaa.com/listings; pricing and status are subject to change. The summary row shows total units and total asking value, the blended price per unit across all listings, and the median published cap rate.

Buyer Profile & Transaction Strategy
Who Is Most Likely to Buy, and How We Create Competition

Market Context

Nine closed sales of five to twelve unit buildings in 90405 since June 2025 frame the subject. The five to seven unit sales closed at $2,170,000 to $2,525,000, and where income was reported, at cap rates of 5.00% to 6.07% and multipliers of 11.58 to 12.89. The two most instructive are 824 Maple St, directly behind the subject, at $2,525,000 and a 5.87% cap in May 2026, and 2332 20th St, a 1959 six-unit of similar mix, at $2,210,000 and a 6.07% cap in July 2026.

The active listings are the other half of the picture. 2648 23rd St, an eight-unit 1949 building with the same one and two bedroom mix and seven renovated units, asks $3.2M at a published 5.50% cap. 1937 17th St, a six-unit 1948 building with two vacancies, asks $2.25M at 5.00%. The subject at $2.45M sits between them on price, below both on price per square foot, and offers a fully occupied roll that neither does.

Positioning Thesis

The right buyer values what is scarce here: a corner lot a mile from the beach, seven paying tenants, a clean title history and two units whose rents reset on turnover. That buyer should be qualified early on whether they will hold for the turnover or want it priced in, because the answer decides whether an offer lands at the top or the bottom of the range.

Likely Buyer Profiles

Likely Buyer 01

Westside Small-Building Owner

Owners who already hold five to fifteen unit buildings in Santa Monica, Venice and Mar Vista, including the buyers on the Maple, 20th Street and Grant Street sales this year. They know the registry, the General Adjustment and the tenant base, and they buy on yield against a known turnover path.

Likely Buyer 02

1031 Exchange Buyer

Sellers trading out of larger or more management-intensive assets into a Westside replacement property under a 45-day identification clock. The 2332 20th St buyer in July was completing an exchange, and a fully occupied Santa Monica corner building at a 5.24% yield is exactly the identification that pool makes.

Likely Buyer 03

Long-Hold Family Investor

Families and individuals who buy Santa Monica apartments to hold for decades, the same profile as the current ownership. They pay for location and tenant stability rather than the first-year yield, and they are the buyers most likely to reach the top of the range.

Transaction Strategy

01

Price Off the Sale Behind the Building

824 Maple St shares the block with the subject and closed in May 2026 at $2,525,000, a 5.87% cap and an 11.58 multiplier. Every buyer who tours will know that sale. Pricing at $2.45M, a 5.24% cap and an 11.93 multiplier on a smaller building with more rent upside sits deliberately in the shadow of that print rather than above it, and the offering should say so rather than let a buyer discover it.

02

Sell the Turnover Story Honestly

Two of the seven units rent at $1,712 and $1,757 against a one-bedroom market of about $2,500. That is roughly $1,500 per month of income that arrives only when those tenants leave, and no one can promise when. The offering should show the current column and the market column side by side, state that the gap is turnover-dependent under Santa Monica rent control, and let the buyer price the timing. Buyers who find that gap on their own treat it as a problem; buyers who are shown it treat it as the reason to buy.

03

Have the Registry and the Bills Ready Before Launch

The documents a Santa Monica buyer asks for on the first call are the Rent Control Board registration for each unit, twelve months of bills, and the seismic retrofit status. Ownership has provided a rent roll and one month of expenses. Assembling the registry printout, a trailing statement and the City's retrofit letter before launch removes the three questions that stall escrows on buildings of this vintage.

Investment Overview
829 Ocean Park Blvd, Santa Monica, CA 90405
7Units
5,682Building SF
1953Year Built
6,603Lot SF

829 Ocean Park Blvd is a seven-unit, two-story apartment building on the northeast corner of Ocean Park Blvd and 9th St in the Sunset Park neighborhood of Santa Monica. The county carries the building at 5,682 SF on a 6,603 SF lot, built 1953 with an effective year of 1959, under zoning code SMR3A. Title has not changed hands in a market sale since the 1975 base year; the recorded transfers since then are a spousal transfer, a trust transfer and a file correction.

The February 27, 2026 rent roll shows all seven units occupied at $1,711.73 to $3,000 per month, $17,107.19 in total. Leasing history supports a mix of one and two bedrooms; the analysis carries four two bedrooms and three one bedrooms pending ownership's confirmation. The building has an on-site laundry room that produced about $100 per month, storage, gas ranges, hardwood floors and non-assigned parking at the rear.

At the recommended $2.45M the property prices at $350,000 per unit and $431 per SF, a 5.24% return on current income and 6.51% at underwritten market rents. The closed Sunset Park sales of the past fourteen months ran $310,000 to $458,000 per unit and $367 to $528 per SF at cap rates of 5.00% to 6.07%, and the sale directly behind the subject on Maple St closed at 5.87%. The subject prices inside every range and below the Maple St yield because its income has more room to grow.

The right buyer values what is scarce here: a corner lot a mile from the beach, seven paying tenants, a clean title history and two units whose rents reset on turnover. That buyer should be qualified early on whether they will hold for the turnover or want it priced in, because the answer decides whether an offer lands at the top or the bottom of the range.

829 Ocean Park

Investment Highlights

  • Seven units on a 6,603 SF corner lot at Ocean Park Blvd and 9th St, built 1953, 5,682 SF per the county
  • 100% occupied at $17,107 per month scheduled, $205,286 per year, with no vacant units on the February 2026 rent roll
  • 5.24% cap rate and 11.93 GRM on current income at the recommended price, 6.51% at underwritten market rents
  • 16% scheduled rent upside on turnover, concentrated in two long-term one-bedroom tenancies at $1,712 and $1,757
  • Family ownership since at least 1975 with a 1975 Proposition 13 base year and no recorded market sale on title
  • Walk Score 87 and Bike Score 88, one mile to Main Street and the beach, with on-site laundry and parking
Location Overview
Sunset Park, Santa Monica, One Mile From Main Street and the Sand

The property sits at the corner of Ocean Park Blvd and 9th St, between Lincoln Blvd and the Ocean Park neighborhood, in the 90405 ZIP code. Ocean Park Blvd runs west to Main Street and the beach in about a mile and east to Santa Monica College and the Expo Line's 17th Street station. Lincoln Blvd, one block west, carries the retail corridor from Rose Avenue to downtown Santa Monica, and Whole Foods, Trader Joe's and Santa Monica Airport Park are all within ten minutes.

The 90405 ZIP code reports 27,298 residents with a median age of 43.1 and a median household income of $121,241, and 69% of its households rent. Median gross rent is $2,417. The parcel scores 87 on Walk Score, 57 on Transit Score and 88 on Bike Score, and sits in FEMA Zone X, an area of minimal flood hazard. HUD's 2026 small-area fair market rents for the ZIP are $2,850 for a one bedroom and $3,550 for a two bedroom.

Sunset Park is one of the few Westside submarkets where small buildings still trade in volume: nine five to twelve unit sales closed in the ZIP between June 2025 and August 2026, including one on the subject's own block. Buyers here are choosing among 1930s to 1970s walk-ups at similar yields, which is why the evidence for this pricing is direct rather than inferred from other neighborhoods.

Property & Location Details
Address829 Ocean Park Blvd, Santa Monica, CA 90405
CitySanta Monica, CA 90405
APN4284-008-001
Year Built1953
Building SF5,682
Lot Size6,603 SF (0.152 ac)
Units7
ParkingOn-site surface parking at the rear of the building off 9th St, described in leasing history as non-assigned with one space offered per unit. The space count and any garage or carport structures should be verified during inspection.
Location Map
Property Details
829 Ocean Park
Property Overview
Units7
Year Built1953
Building SF5,682
Lot SF6,603
APN4284-008-001
Unit Mix
3x 1 Bed / 1 Bath-
4x 2 Bed / 1 Bath-

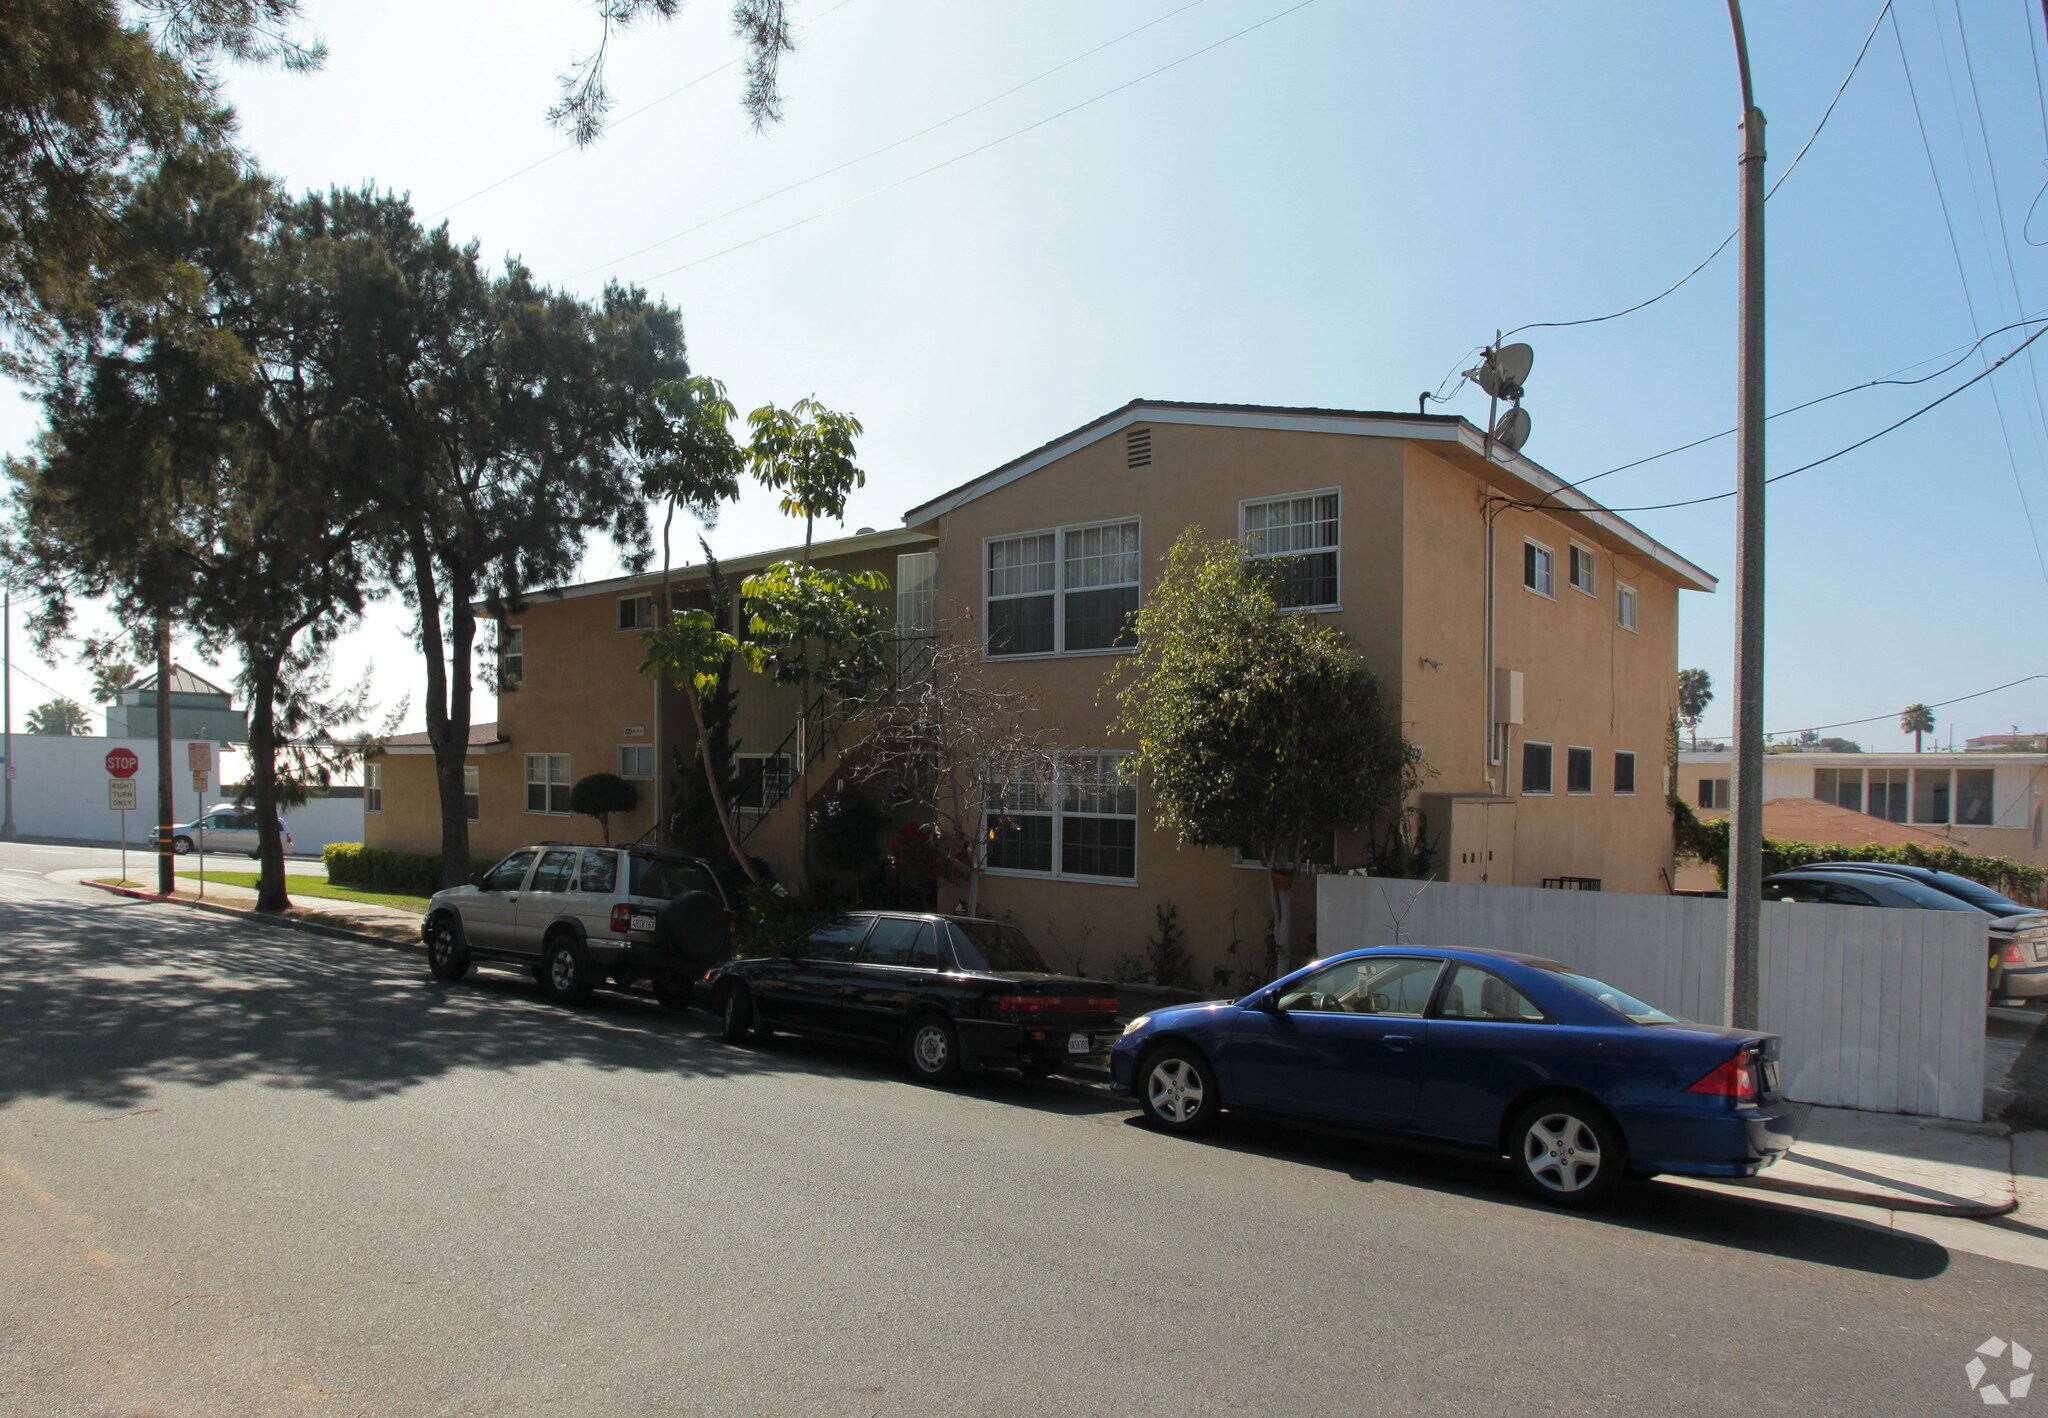
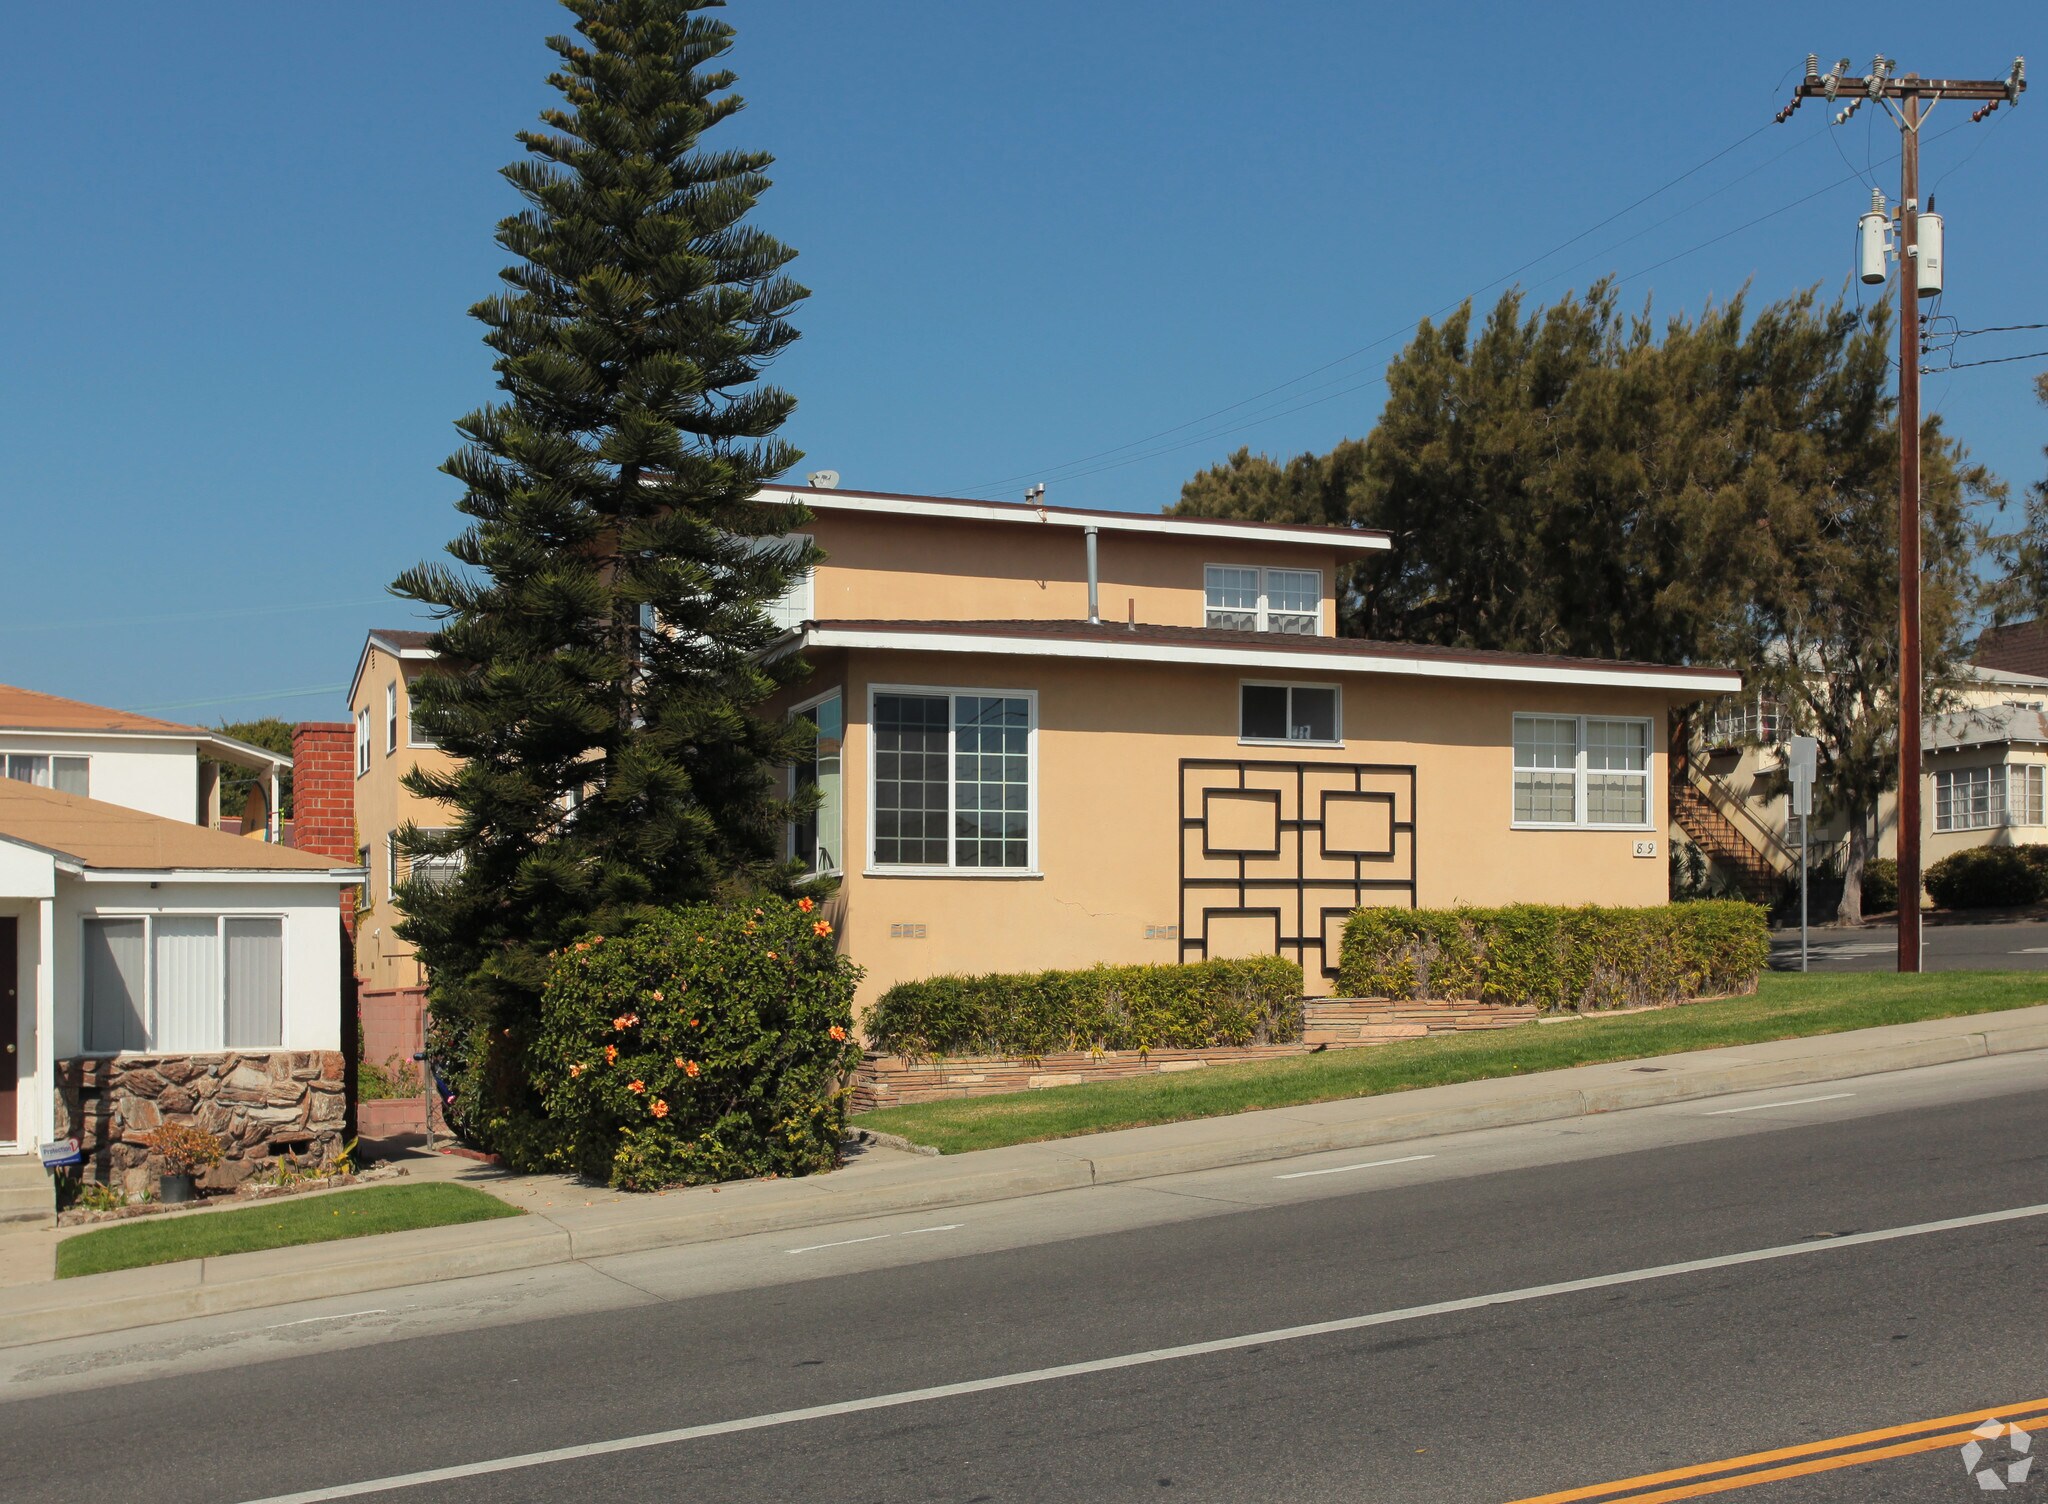
The building is a two-story wood-frame and stucco structure of 5,682 SF on a 6,603 SF corner lot, built 1953. The street elevation on Ocean Park Blvd carries a decorative wrought-iron screen, a flagstone planter and a lawn; the 9th St side holds the exterior stair and the gated parking area at the rear. The county records seven units and no per-unit areas.

Leasing history describes the units as one and two bedrooms with gas ranges, hardwood floors and, in the units turned most recently, new paint, new kitchens and remodeled baths; one two bedroom was advertised at 850 SF with central air. The building has a common laundry room, storage space and non-assigned on-site parking with one space offered per unit. Unit square footages are not published by the county or ownership and are omitted from this analysis.

A 1953 building under one family's ownership for fifty years will be underwritten by buyers on what has not been done as much as what has. Ownership's schedule shows a well-run building with modest bills, but it is one month of expenses rather than a year, and the seismic retrofit status, roof, plumbing and electrical service should be documented before launch. This analysis carries repairs at $800 per unit and reserves at $250 per unit rather than the owner's actual cost.

Property Photos
829 Ocean Park
1 / 2 829 Ocean Park photo
Exterior

Click any image to enlarge. Images depict the property and representative interiors. Source: listing media and site photography.

Rent Comparables
Achieved and Asking Rents in the Immediate Submarket
Rent Comps Map

One Bedroom Comparables

AddressUnit TypeSFAsking RentDistance
1828 Cedar St, Santa Monica1 Bed / 1 Bath700 (est.)$2,1900.17 mi
21218 Bay St, Santa Monica1 Bed / 1 Bath-$2,2500.45 mi
31311 Marine St, Santa Monica1 Bed / 1 Bath575 (est.)$2,6000.48 mi
42004 Oak St, Santa Monica1 Bed / 1 Bath-$2,6500.80 mi
52262 31st St, Santa Monica1 Bed / 1 Bath-$2,6751.62 mi
6660 Ocean Park Blvd, Santa Monica1 Bed / 1 Bath-$2,8750.17 mi
71112 Ocean Park Blvd, Santa Monica1 Bed / 1 Bath725 (est.)$2,9000.13 mi
Average (7 comps)667 (incl. est.)$2,5910.55 mi

Two Bedroom Comparables

AddressUnit TypeSFAsking RentDistance
82015 17th St, Santa Monica2 Bed / 1 Bath700 (est.)$2,7950.77 mi
92240 28th St, Santa Monica2 Bed / 1 Bath850 (est.)$2,8001.42 mi
101846 10th St, Santa Monica2 Bed / 1 Bath908 (est.)$2,8950.59 mi
112426 20th St, Santa Monica2 Bed / 1 Bath-$2,9950.76 mi
121948 20th St, Santa Monica2 Bed / 1 Bath-$3,2000.96 mi
131315 Ocean Park Blvd, Santa Monica2 Bed / 1 Bath-$3,3000.27 mi
14817 Hill St, Santa Monica2 Bed / 1 Bath-$3,4500.14 mi
71112 Ocean Park Blvd, Santa Monica2 Bed / 1 Bath920 (est.)$3,8000.13 mi
Average (8 comps)844 (incl. est.)$3,1540.63 mi

Rent evidence is read plan by plan. Seven one-bedroom listings in Sunset Park run $2,190 to $2,900 and average $2,591, with the two on Ocean Park Blvd at $2,875 and $2,900 and an unrenovated 700 SF unit two blocks away at $2,190. Eight two-bedroom listings run $2,795 to $3,800 and average $3,154; the 850 to 908 SF units with published area ask $2,800 to $2,895, and a renovated two bedroom one block south on Hill St asks $3,450.

The market column carries $2,500 for the one bedrooms and $3,100 for the two bedrooms, below the listing averages and below HUD's 2026 fair market rents for the ZIP. The subject's most recent leases at $2,550 and $2,795 to $3,000 confirm the two-bedroom figure is achievable without renovation. The gap between the current and market columns is $2,793 per month, and about $1,500 of it sits in the two long-term one-bedroom tenancies, which under Santa Monica rent control recover only when those tenants choose to leave.

Sale Comparables
9 Closed Sales in the Submarket
Sale Comps Map
AddressYrUnitsBldg SFSale Price$/Unit$/SFGRMCapDate
1824 Maple St, Santa Monica197366,882$2,525,000$420,833$36711.585.87%2026-05-07
22332 20th St, Santa Monica195965,420$2,210,000$368,333$40811.766.07%2026-07-31
3711 Grant St, Santa Monica195666,128$2,330,000$388,333$38012.07-2026-07-22
41044 Pacific St, Santa Monica196354,646$2,289,000$457,800$493-5.00%2026-06-30
52411 20th St, Santa Monica193575,937$2,170,000$310,000$36612.89-2026-08-24
61807 Oak St, Santa Monica197954,607$2,220,000$444,000$482--2026-06-25
72336 34th St, Santa Monica196665,924$2,310,000$385,000$390--2025-12-05
82820 3rd St, Santa Monica196264,636$2,446,000$407,667$528--2025-06-27
92318 16th St, Santa Monica19771220,805$4,870,000$405,833$23412.18-2026-08-05
Median (9 comps)5,924$2,310,000$405,833$39012.075.87%-

Nine closed sales of five to twelve unit buildings in 90405 since June 2025 frame the subject. The five to seven unit sales closed at $2,170,000 to $2,525,000, and where income was reported, at cap rates of 5.00% to 6.07% and multipliers of 11.58 to 12.89. The two most instructive are 824 Maple St, directly behind the subject, at $2,525,000 and a 5.87% cap in May 2026, and 2332 20th St, a 1959 six-unit of similar mix, at $2,210,000 and a 6.07% cap in July 2026.

The active listings are the other half of the picture. 2648 23rd St, an eight-unit 1949 building with the same one and two bedroom mix and seven renovated units, asks $3.2M at a published 5.50% cap. 1937 17th St, a six-unit 1948 building with two vacancies, asks $2.25M at 5.00%. The subject at $2.45M sits between them on price, below both on price per square foot, and offers a fully occupied roll that neither does.

1. 824 Maple St, Santa Monica - Directly behind the subject on the same block, closed four months ago with reported income; the anchor comparable. Six units in 6,882 SF, built 1973, two stories, on the same block as the subject: two 1 bed / 1 bath, three 2 bed / 2 bath and one 3 bed / 2 bath of roughly 1,000 SF average. Closed at a 5.87% cap and 11.58 gross rent multiplier on $148,268 of reported net operating income; listed by Roque & Mark, sold to a private buyer represented by CBRE.

2. 2332 20th St, Santa Monica - Closest vintage match in the set with reported income and a two-bedroom-heavy mix like the subject's. Six units in 5,420 SF across two buildings, built 1959: two 1 bed / 1 bath and four 2 bed / 1 bath of about 1,288 SF. Closed at a 6.07% cap and 11.76 gross rent multiplier; the buyer was completing a 1031 exchange. Listed by Lyon Stahl.

3. 711 Grant St, Santa Monica - Recent Ocean Park closing with a published multiplier, but sold with vacancies and a pro forma cap that cannot be treated as in-place yield. Six units in 6,128 SF across two buildings, built 1956, five surface spaces, four tenths of a mile west of the subject. Marketed at $2,495,000 as a high-vacancy property and closed at $2,330,000 (93% of ask). CoStar records a 6.08% pro forma cap and a 12.07 gross rent multiplier; the pro forma cap is not carried.

4. 1044 Pacific St, Santa Monica - Three blocks north with a reported in-place cap; the highest price per square foot of the income-supported sales. Five units in 4,646 SF, built 1963, seven covered spaces: one 1 bed / 1 bath of 780 SF and four 2 bed / 1 bath of 950 SF. Closed at a 5.00% actual cap with 20% vacancy at sale; listed and sold by KW Advisors.

5. 2411 20th St, Santa Monica - The only seven-unit sale in the set and the most recent closing; older single-story product on a larger lot. Seven units in 5,937 SF across three single-story buildings, built 1935, on a 13,544 SF lot with garages and surface parking. Closed at a 12.89 gross rent multiplier; no cap rate was reported. Listed by RE/MAX Commercial.

6. 1807 Oak St, Santa Monica - Newest vintage in the set; supports price per unit and per square foot only. Five units in 4,607 SF across three single-story buildings, built 1979: four one bedrooms of about 668 SF and one 3 bed / 2 bath. Sold by a Japanese corporate owner through Compass; no income was published.

7. 2336 34th St, Santa Monica - All-two-bedroom 1966 building in eastern Sunset Park; per-unit and per-square-foot evidence only. Six 2 bed / 2 bath units of about 1,116 SF in 5,924 SF, built 1966, two stories. Sold to a local private buyer through Compass Commercial; no income was published.

8. 2820 3rd St, Santa Monica - Older sale closer to the ocean; carried for the per-square-foot ceiling on 1960s stock west of Lincoln. Six units in 4,636 SF, built 1962, in the Ocean Park neighbourhood five blocks from the beach. Deed-verified price from the LAAA Comps database; no income was published and the sale is now fourteen months old.

9. 2318 16th St, Santa Monica - Larger 1970s building included for its recent multiplier only; scale and vintage limit its weight. Twelve units in 20,805 SF, built 1977, two stories with 28 covered spaces; twice the subject's unit count and more than three times its area. Closed at a 12.18 gross rent multiplier with one vacancy; listed by RE/MAX Commercial.


Opinion of Value
Suggested List Price and Expected Sale Range
BasisPrice$/Unit$/SFGRM CurrentGRM Pro FormaCap CurrentCap Pro Forma
Suggested list price$2,450,000$350,000$431.1911.9310.265.24%6.51%
Range top$2,550,000$364,286$448.7912.4210.684.99%6.21%
Midpoint$2,450,000$350,000$431.1911.9310.265.24%6.51%
Range bottom$2,350,000$335,714$413.5911.459.845.51%6.84%

Property taxes reassess at the sale price, so the net operating income and therefore the capitalization rate are recalculated at every rung above.

On-Market Comparables
Active Competition and the Pricing Ceiling
On-Market Comps Map

Side by Side: 829 Ocean Park vs 2648 23rd St, Santa Monica

829 Ocean Park2648 23rd St, Santa Monica
List Price$2,450,000$3,200,000
Price per Unit$350,000$400,000
Price per SF$431.19$508.42
Cap Rate5.24%5.50%
GRM11.9310.90
Units78
Year Built19531949
Building SF5,6826,294

Side by Side: 829 Ocean Park vs 1937 17th St, Santa Monica

829 Ocean Park1937 17th St, Santa Monica
List Price$2,450,000$2,250,000
Price per Unit$350,000$375,000
Price per SF$431.19$464.88
Cap Rate5.24%5.00%
GRM11.9311.92
Units76
Year Built19531948
Building SF5,6824,840

Side by Side: 829 Ocean Park vs 2218 24th St, Santa Monica

829 Ocean Park2218 24th St, Santa Monica
List Price$2,450,000$2,950,000
Price per Unit$350,000$590,000
Price per SF$431.19$864.60
Cap Rate5.24%4.83%
GRM11.9313.94
Units75
Year Built19531947
Building SF5,6823,412
AddressYrUnitsBldg SFList Price$/Unit$/SFGRMCapDate
12648 23rd St, Santa Monica194986,294$3,200,000$400,000$50810.905.50%2026-09-02
21937 17th St, Santa Monica194864,840$2,250,000$375,000$46511.925.00%2026-09-02
32218 24th St, Santa Monica194753,412$2,950,000$590,000$86513.944.83%2026-09-02
Median (3 comps)4,840$2,950,000$400,000$50811.925.00%-

2648 23rd St, Santa Monica - The closest active match by unit mix and vintage; its ask marks the ceiling a renovated Sunset Park eight-unit is testing. Eight units in 6,294 SF on a 9,283 SF corner lot, built 1949: four 2 bed / 1 bath and four 1 bed / 1 bath, six garages and a carport, seven of eight units upgraded.

1937 17th St, Santa Monica - Priced below the subject on a per-unit basis with vacancies to lease; the most direct read on where a six-unit Sunset Park building is being offered today. Six units in 4,840 SF across two buildings, built 1948: one 3 bed / 1.5 bath, four 2 bed / 1 bath and a detached 2 bed / 1 bath house; two-car garage plus eight open spaces.

2218 24th St, Santa Monica - Small-unit single-family-street offering at $590,000 per unit and $865 per SF; a ceiling reference rather than a match. Five units in 3,412 SF, built 1947, on an SMR1 street: a 2 bed / 1.5 bath front house, three one bedrooms and a studio, two garages.

Financial Analysis
829 Ocean Park

Unit Mix & Scheduled Rent

UnitTypeApprox SFStatusCurrent RentMarket Rent
Unit 12 Bed / 1 Bath-Occupied$3,000$3,100
Unit 21 Bed / 1 Bath-Occupied$1,757$2,500
Unit 31 Bed / 1 Bath-Occupied$1,712$2,500
Unit 42 Bed / 1 Bath-Occupied$2,795$3,100
Unit 52 Bed / 1 Bath-Occupied$2,550$3,100
Unit 61 Bed / 1 Bath-Occupied$2,550$2,500
Unit 72 Bed / 1 Bath-Occupied$2,744$3,100
Total Scheduled Rent$17,107$19,900
Additional Income[1]$100$100
Monthly Scheduled Gross Income$17,207$20,000

Annualized Operating Data

 CurrentMarket
Scheduled Gross Income[2]$206,483$239,997
Vacancy Reserve at 3.0%[3]($6,159)($7,164)
Gross Operating Income$200,325$232,833
Operating Expenses($71,998)($73,298)
Net Operating Income$128,327$159,535

Annualized Expenses

 CurrentPro Forma
Real Estate Taxes[4]$31,386$31,386
Insurance[5]$7,082$7,082
Utilities - Electric[6]$1,382$1,382
Utilities - Water & Sewer[7]$8,132$8,132
Utilities - Gas[8]$338$338
Trash Removal[9]$4,654$4,654
Repairs & Maintenance[10]$5,600$5,600
Landscaping[11]$2,400$2,400
Pest Control[12]$1,261$1,261
Replacement Reserves[13]$1,750$1,750
Management Fee (4.0% of EGI)[14]$8,013$9,313
Total Operating Expenses$71,998$73,298
Expense Ratio35.9%31.5%
Per Unit$10,285$10,471
Per Square Foot$12.67$12.90

Notes to the Operating Statement

[1] Additional Income: Laundry income in place: $99.75 per month collected in March 2026 per ownership's workbook, $1,197 per year. January 2026 was $109.14.

[2] Scheduled Gross Income: Seven occupied units at the rents on the February 27, 2026 ownership rent roll, $17,107.19 per month or $205,286 per year. The market column carries $2,500 for the one bedrooms and $3,100 for the two bedrooms, supported by the Sunset Park rent comparables, and applies only on turnover under Santa Monica vacancy decontrol.

[3] Vacancy Reserve: 3.0% of scheduled gross rent, the LAAA standard for a fully occupied whole-unit building. The building is 100% occupied.

[4] Real Estate Taxes: Reassessed at the recommended list price of $2,450,000 at the 1.203757% fiscal 2025/2026 rate for tax rate area 8604 ($29,492), plus $1,894 of flat direct assessments carried from the 2025 bill. Ownership pays $4,464 on a 1975 base-year assessment.

[5] Insurance: LAAA allowance of $200 per unit plus $1.00 per gross square foot, $7,082. Ownership's current premium is $6,667; a buyer should obtain quotes.

[6] Utilities - Electric: House meter only: ownership's March 2026 Southern California Edison bill of $115.17 annualized to $1,382. Units appear to be separately metered.

[7] Utilities - Water & Sewer: Ownership's March 2026 City of Santa Monica water ($431.70) and sewer ($245.98) bills annualized to $8,132.

[8] Utilities - Gas: Laundry room gas only: ownership's March 2026 bill of $28.16 annualized to $338.

[9] Trash Removal: Ownership's March 2026 City of Santa Monica refuse and recycling bill of $387.85 annualized to $4,654.

[10] Repairs & Maintenance: $800 per unit per year, $5,600, for a 1953 building. Ownership's schedule carries no repairs line.

[11] Landscaping: Gardening at $200 per month on ownership's schedule, $2,400 per year. The schedule prints the line twice; it is counted once.

[12] Pest Control: Ownership's monthly Orkin service of $105.10 annualized to $1,261.

[13] Replacement Reserves: $250 per unit per year, $1,750. Ownership's schedule carries no reserve.

[14] Management Fee (4.0% of EGI): 4.0% of effective gross income, $8,013. Ownership currently pays a third-party manager $958.74 per month ($11,505, about 5.6% of rent), so the underwritten figure is below the seller's actual cost.

Owner-reported figures are unaudited. A buyer should verify all income and expenses in due diligence.

Summary
Operating Data
Price$2,450,000
Number of Units7
Price per Unit$350,000
Price per SF$431.19
Current GRM11.93
Market GRM10.26
Current Cap Rate (LAAA calculation: current NOI / recommended value)5.24%
Market Cap Rate (LAAA calculation: market NOI / recommended value)6.51%
Acquisition Structure
StructureAll Cash
Equity Required$2,450,000

The recommended list price is $2.45M, inside an opinion-of-value range of $2.35M to $2.55M. Current scheduled income of $205,286 less a 3% vacancy reserve plus $1,197 of laundry income gives $200,325 of effective gross income; operating expenses of $71,998, including taxes reassessed at the list price, produce net operating income of $128,327, a 5.24% cap rate and an 11.93 gross rent multiplier. At underwritten market rents of $238,800 the net operating income is $159,535 and the cap rate 6.51%. The price is $350,000 per unit and $431 per SF.

Against the evidence, the price is disciplined. It sits inside the closed per-unit range, inside the closed per-square-foot range, at a yield between the 5.00% Pacific St sale and the 5.87% Maple St sale, and at a multiplier between Maple and 20th Street. The reasons it is not higher are the same reasons it is defensible: two units 30% under market that recover only on turnover, a one-month expense record, and a 1953 building whose retrofit status is not yet documented. A buyer who underwrites the turnover will pay the top of the range; a buyer who prices it out will pay the bottom.

Recommended List Price
$2,450,000

Supported value range: $2,350,000 to $2,550,000

Disclosures

Scheduled income is the ownership rent roll as of February 27, 2026, all seven units occupied. Laundry income is the March 2026 collection of $99.75 per month. Taxes are reassessed at the list price at the 1.203757% rate for tax rate area 8604 plus $1,894 of flat direct assessments carried from the 2025 bill. Utilities ($14,506), gardening ($2,400) and pest control ($1,261) are ownership's March 2026 bills annualized. Insurance is the LAAA allowance of $7,082 against a current premium of $6,667; repairs are $800 per unit and reserves $250 per unit; management is 4% of effective gross income against $11,505 currently paid.

No trailing twelve-month statement was provided, so the expense build is an allowance-based estimate. The bedroom mix is provisional: leasing history supports unit 4 as a two bedroom and unit 6 as a one bedroom and the rest are inferred from rent level. Unit square footages are not published and are omitted. Market rents are asking rents from Sunset Park listings retrieved September 2, 2026 and apply only on turnover under Santa Monica rent control. Comparable cap rates and multipliers are as recorded by CoStar or published by listing brokers and were not independently audited.